
Countries around the world have different ways of covering their citizens’ pension rights.
Some countries use pre-funded systems that use asset pools accumulated during members’ work life to meet pension requirements when they retire. These funds can be held in public funds, private, or both.
Other countries use pay as you go systems, where social contributions from the working population pay for current pensions. Most countries use a combination of the 2 systems.
In an economic environment where governments run persistent budget deficits and large debt burdens, and where the proportion of retirees to those working is increasing, the pay as you go system is increasingly challenged.
On the other hand, pre-funded systems are vulnerable to market volatility.
Today, after 10 years of economic recovery and riding on buoyant equity markets, pension funds assets show strong growth, globally. But are they large enough to meet expectations?
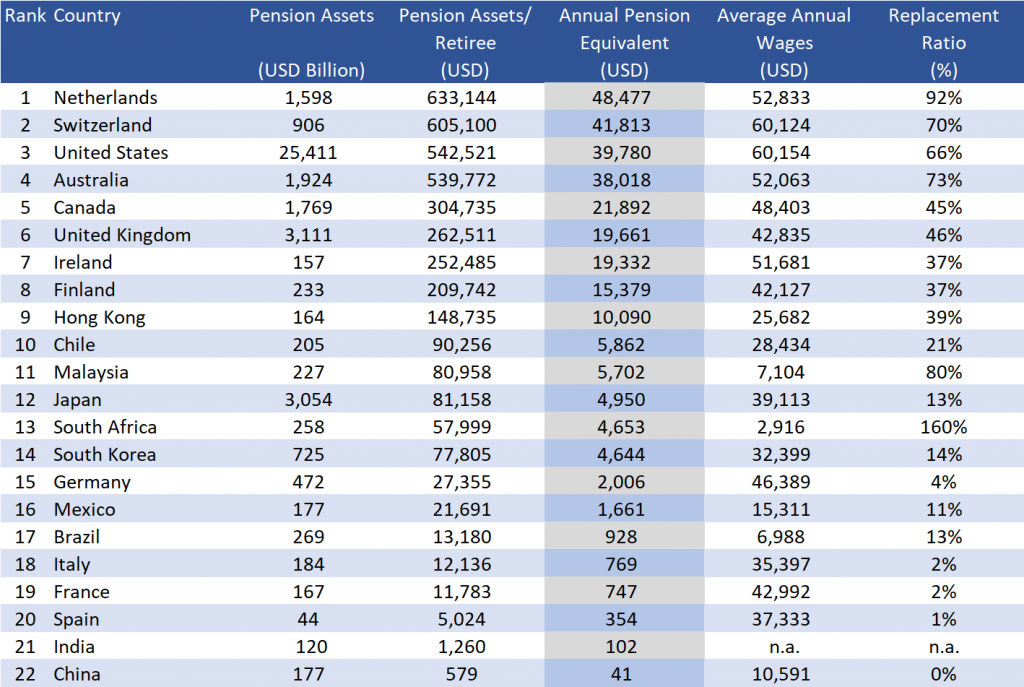
We looked at the 22 countries with the largest pension funds in the world (Source: P22 in Willis Towers Watson and Thinking Ahead Institute, “Global Pension Study 2018”) and ranked them based on their size compared to their retirement age populations. We then transformed asset values per capita into annual pensions equivalents by using annuity factors adjusted for differences in retirement ages and life expectancies. Finally, we compared these pension equivalent numbers to average wages to see a rough measure of the replacement ratio from the asset base alone, without taking into account social security payments.
Of note, this analysis excludes assets in Sovereign Wealth Funds which may have a social mandate, but broader scope than just providing retirement benefits to their members. Also Norway’s $1.0 trillion Government Pension Fund has also been excluded, as, unlike typical pension funds, it derives its asset base from oil profits, not member contributions.
Key Findings
- Top 4 countries ranked in terms of assets per person of retirement age are Netherlands, Switzerland, the US and Australia. They currently have over $500,000 in pension assets per person of retirement age, that may be able to sustain pensions that are, on average, more than 60% of the mean wage in those countries.
- Next group of countries: Canada, the UK, Ireland, Finland and Hong Kong show asset based replacement ratios of 37% to 46%. This is unlikely to meet retirement expectations without social support payments and/ or private savings.
- Some of the largest European economies: Germany, France, Italy are predominantly pay as you go systems and their pre-funded schemes play a relatively small role in the overall retirement funding mix.
- Perhaps unsurprisingly, Japan’s $3.1 trillion in pension funds (among the largest in the world in absolute) are not sufficient to cover fully the pension needs of its large senior population.
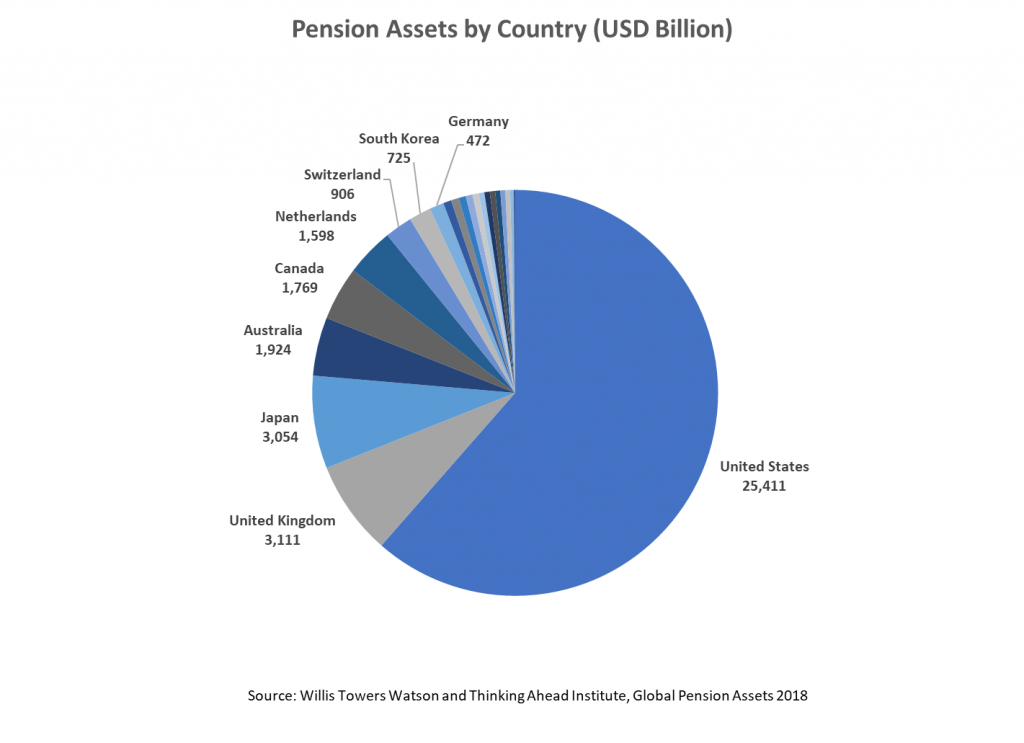
Pension Assets By Country
There are large discrepancies even among wealthy countries with respect to the size of their assets across various public and private pension funds.
- The US shows by far the largest pension asset base (including individual Investment Retirement Accounts), at $25.4 trillion.
- The next largest pension funds are in the UK at $3.1 trillion, Japan at $3.1 trillion. Then Australia at $1.9 trillion, Canada at $1.8 trillion and Netherlands at $1.6 trillion. Switzerland has just under $1.0 trillion and South Korea $750 billion.
- The rest are well below $500 billion.
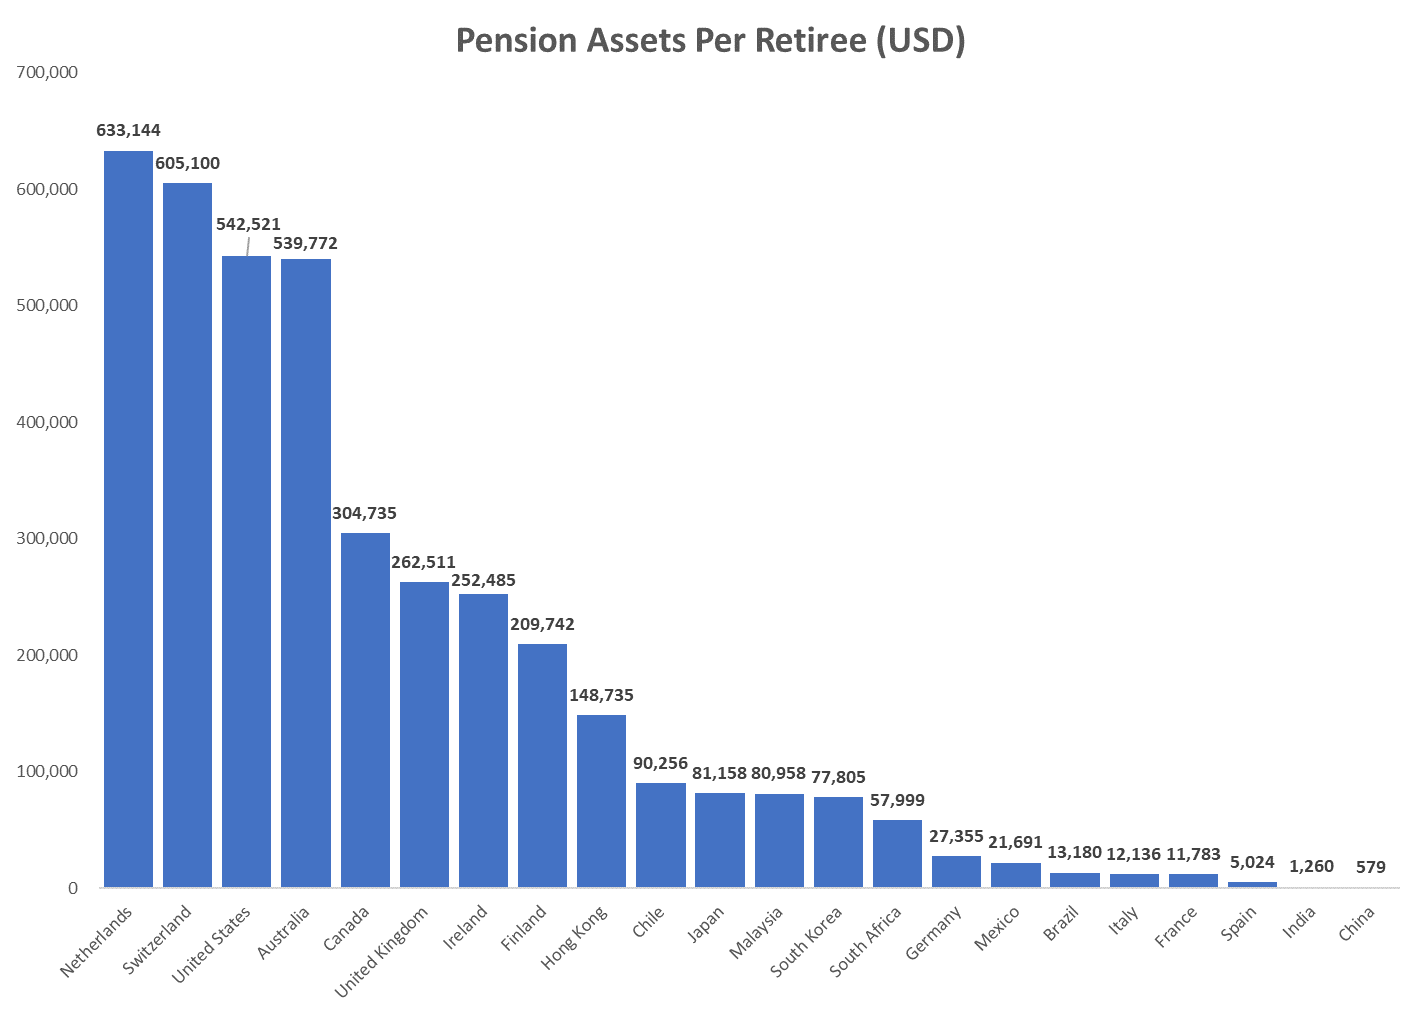
Pension Assets Per Retiree (based on population of retirement age)
To compare countries of different sizes, we divided pension fund assets by the retirement age population in each country. Clearly, this is an over simplification and provides a high limit of the actual assets available per retired person, as some of the pension funds assets may be attributable to people still working.
Nevertheless, based on this measure, the Dutch rank at the top with $633k in pension assets per retirement age person, followed by the Swiss with $605k, US and Australia with around $540k, Canada with over $300k and the UK with around $260k per person.
Japan ranks only 11 low in terms of assets per person of retirement age, due to its large aging population and a relatively low retirement age at 62.

Annual Pension Equivalent vs. Average Wages
To calculate a proxy for annual pensions, we translated pension assets per capita into equivalent annuities, using annuity factors adjusted for life expectancy at the retirement age. We then calculated a replacement ratio which compares the pension proxies against the average wages in each country.
The top 4 countries as ranked by assets per capita show replacement ratios above 60%, which looks healthy. In addition, Malaysia (80%) and South Africa (160%) show high replacement ratios, but their numbers may be distorted due to specific factors related to the way their pension funds are structured.
This data suggests that most other countries have pension assets that are insufficient to meet comfortable pensions for its retirees and rely on on-going social contribution payments to cover their needs.
This isn’t necessarily a function of the country’s wealth, as shown by low asset based pension coverage in some of the largest economies in Europe: Germany, France, Italy, Spain. Aging population, sustained government deficits and high sovereign debt will continue to add pressure on retirement systems in these countries.
Conclusions
- Except for the lucky members of pension systems in one of the top 4 countries, chances are that most people rely to a certain degree on government social redistribution systems to cover for their golden years. Unfortunately, these social contracts look stretched in many countries.
- Even for the 4 top countries, the actual pensions may be lower than suggested by our numbers. As described we likely over-estimated assets available to retired people, as a portion may be earmarked for people still working. Also the dispersion around the average numbers may be particularly high in countries with high income inequality, which means that many individuals in those countries may still have low pension cover.
- Saving and investing for retirement is more vital than ever to ensure proper coverage in retirement.
We created GWAP to help investors at all levels of wealth and financial knowledge to apply sound investing strategies and processes used by some of the largest pension funds in the world, to build their wealth over the long term.
Data Sources
Pension funds assets: Willis Towers Watson and Thinking Ahead Institute, “Global Pension Assets Study 2018”
Population and longevity: UN “World Population Prospects: The 2017 Revision”
Retirement age: OECD, Wikipedia
Average wages: OECD, ILO
Interest rates: Bloomberg
Disclaimer
This document is not intended as a recommendation of or an offer or solicitation to purchase or sell any security or other investments, or as a recommendation of an investment manager, or as a means to attract any funds or deposits. It is also not an official statement of GWAP Financial.
Although information in this document has been obtained from sources believed to be reliable, GWAP Financial and its affiliates do not guarantee its accuracy or completeness and accept no liability for any direct or consequential losses arising from its use.
Investments mentioned in this document may not be suitable for all investors. Before making any investment, each investor must obtain the investment offering materials, which include a description of the risks, fees and expenses and the performance history, if any, which may be considered in connection with making an investment decision. Each investor should carefully view the risks associated with the investment and make a determination based upon the investor’s own particular circumstances, that the investment is consistent with the investor’s investment objectives.
Opinions expressed herein are not intended to be a forecast of future events, a guarantee of future results or investment advice, and are subject to change based on market and other conditions. In any case, past performance is no guarantee of future results, and future results may not meet our expectations due to a variety of economic, market and other factors. Further, any projections of potential risk or return are illustrative and should not be taken as limitations of the maximum possible loss or gain.
The information contained herein is not intended to be an exhaustive discussion of the strategies or concepts mentioned herein or tax or legal advice. GWAP Financial assumes that, before making any commitment to invest, the investor has taken whatever tax, legal or other advice the investor considers necessary and that the investor has arranged to account for any tax lawfully due on the income or gains arising from any investment product provided by GWAP. GWAP can accept no responsibility for the tax treatment of any investment.
Razvan
Excellent “raison d’etre” for GWAP!
Thank you for a good argument to care more about saving and investment performance.
Alan Glasser
Interesting reading to be sure. I live in the U.S.A. and was pleased to see that “we” are so highly funded. I am trying to find how well funded MY retirement plan is. I contacted MTRS (MA Teacher’s Retirement System) and they sent me a link to a chart telling me how the fund is invested. Is there an organization that provides information on how well FUNDED the retirement plan is?
Thanks.
Alan in NH