
Summary
In this article we show how we select top performing balanced funds from the Morningstar coverage universe and then replicate their asset allocations on GWAP using ETFs.
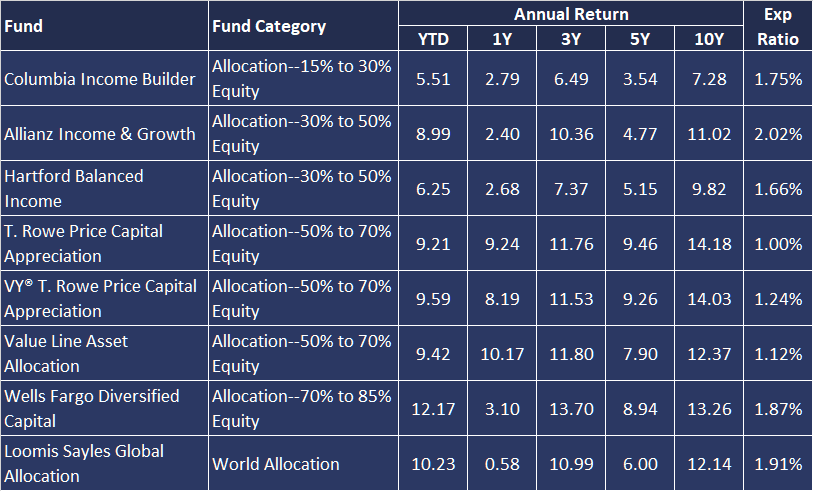
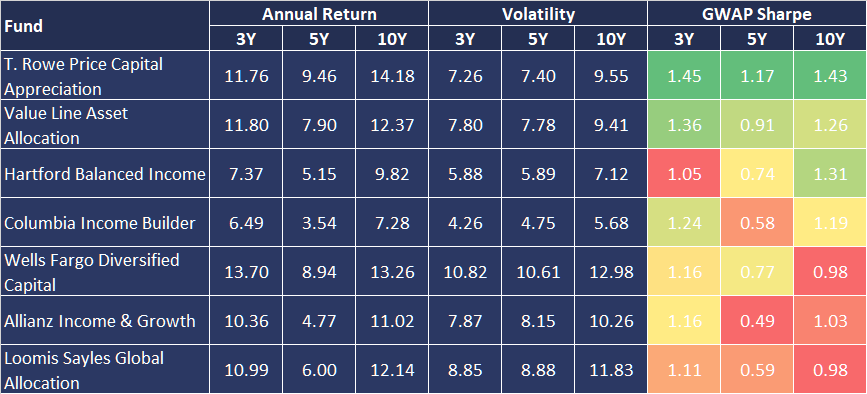
As of February 2019, our top fund picks, based on consistent risk adjusted outperformance were:
- T. Rowe Price Capital Appreciation
- Value Line Asset Allocation
- Hartford Balanced Income
- Columbia Income Builder
- Wells Fargo Diversified Capital
- Allianz Income & Growth
- Loomis Sayles Global Allocation
We illustrate in detail how we constructed a GWAP portfolio model by mapping high quality, low cost ETFs to the actual T. Rowe Price Capital Appreciation asset allocation.
The net result is a GWAP model portfolio of 18 ETFs with a blended average ETF expense ratio of 0.285%. GWAP advisory fee for these strategic models is 0.25%. T Rowe Price management fee for the fund is 1.0% for the “Advisor” class.
1. Fund Screening
We used Morningstar basic fund screening to find out the 5 star rated asset allocation funds that are reasonably balanced between their fixed income and equity allocations, have higher than average returns with average, or better risk.
For this, we used the following screening parameters:
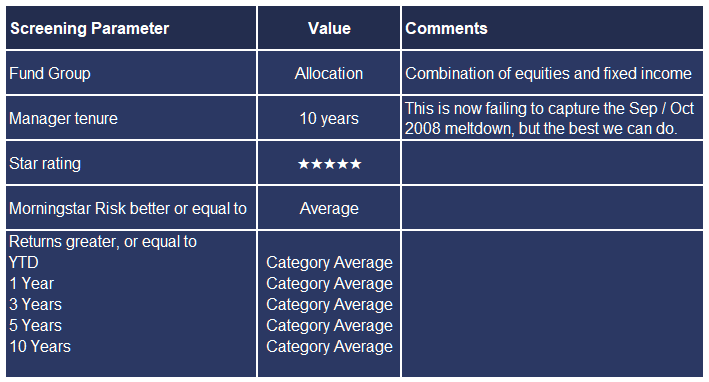
Perhaps unsurprisingly this yielded no results. It is challenging enough for any fund manager to beat the average return, but to do that consistently with average, or lower risk it is (almost) “mission impossible”.
To get practical results we relaxed some of the parameters and also added some additional restrictions:
- Took out the risk-based criterion. In other words we accept that higher than average return comes with higher than average risk.
- Eliminated the requirement for YTD outperformance, as the short measurement period is irrelevant for the longer term performance.
- Added requirement for assets under management to exceed $100 million.
- Eliminated funds focused on convertibles (not truly a balanced fund) and those from the category of 85%+ Equity (at that level Equities could represent well above 95%+ of the portfolio risk, and therefore not meeting our balanced portfolio criterion).
- Eliminated ITRAX, a clone fund managed by Voya Investments, and kept the underlying fund: T. Rowe Price Capital Appreciation.
The adjusted search produced the following funds (as of 26 Feb 2019):
2. Fund Ranking
We always think about investment performance in terms of risk adjusted returns.
The Sharpe Ratio, developed by Nobel Laureate William Sharpe, puts risk and return together by calculating excess return of an investment over the risk free rate, divided by the volatility of returns.
We calculated our own Sharpe ratios over 3, 5 and 10 years using the Morningstar volatility numbers and our own risk free rates over those time frames (we did not use Morningstar Sharpe Ratios as their calculation seems inconsistent across our fund selection).
The funds were then ranked based on their average Sharpe ratio across the 3 timeframes. Here are the results, with the best on top:
3. Fund Replication in GWAP
We created model portfolios in GWAP that are using high quality ETFs (low cost, high liquidity) to replicate the asset allocations used by these top performing funds.
We will use T. Rowe Price Capital Appreciation (PRWCX) to illustrate how we are doing it.
3.1. Mapping main Asset Classes
In GWAP we use the following main asset classes, which are consistent with the way wealth managers and strategic investors (e.g. pension plans) are thinking about their investment universe:
- Cash
- Fixed Income
- Equities
- Real Estate
- Natural Resources
Morningstar main asset classes are:
- Cash
- US Stock
- Non-US
- Stock
- Bond
- Other
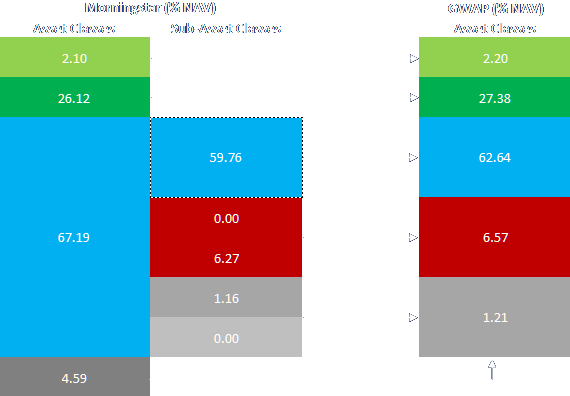
Quite a bit of a mismatch. However, it is possible to approximately recreate the GWAP asset class allocations by going deeper into the Morningstar classifications:
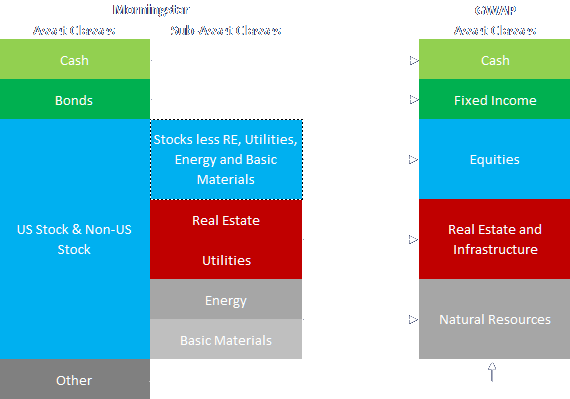
Note that Morningstar “Other” category gets reallocated across all GWAP asset classes on a pro-rata basis. That causes that even 1 to 1 corresponding asset classes to receive a different allocation in GWAP.
This is how the main asset class mapping looks in the case of PRWCX:
3.2. Mapping Equities
Morningstar shows the breakdown of equities by US and International, as well as allocation by Sector. The sectors are mapped quite easily to specific industry focus and geography focused ETFs in GWAP.
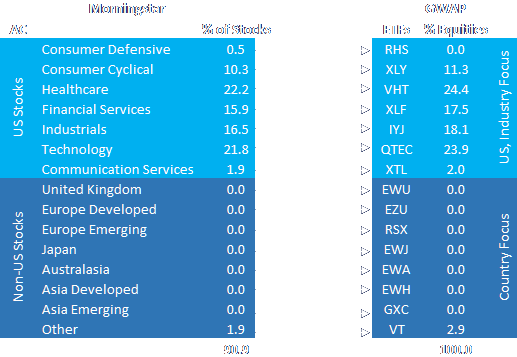
Note how Morningstar sectors and geographies do not add to 100%, as real estate, utilities, energy and basic materials are mapped to separate asset classes. As a result, the MS sector allocations are rebased pro-rata to their GWAP equivalents. In the process we also eliminate under 1% (of asset class) allocations which are too small to be meaningful for the performance, but add to trading cost.
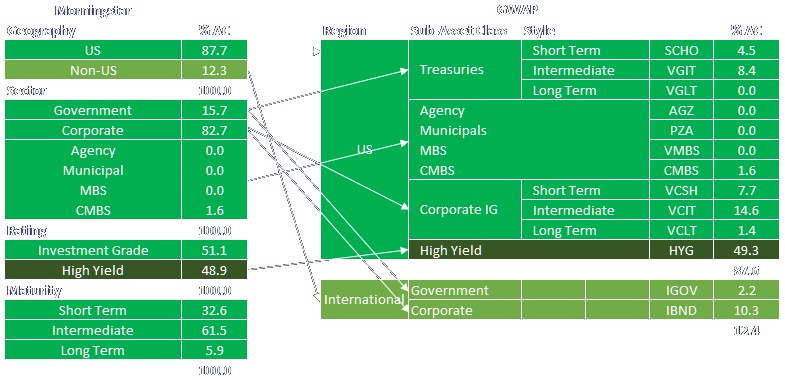
3.3. Mapping Fixed Income
Morningstar data on fixed income comprises 4 views structured by: geography, bond sector, credit rating and maturity. These views are presented on an aggregated basis and makes it impossible to discern the mix inside each of the categories presented.
To ensure consistency we kept the same split of asset styles (such as short term, intermediate and long term fixed income) across different sub asset classes (e.g. government, or corporate).
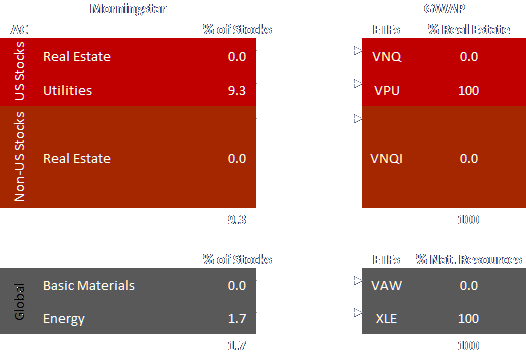
3.4. Mapping Real Estate / Infrastructure and Natural Resources
This is done in a fairly straight forward way as follows:
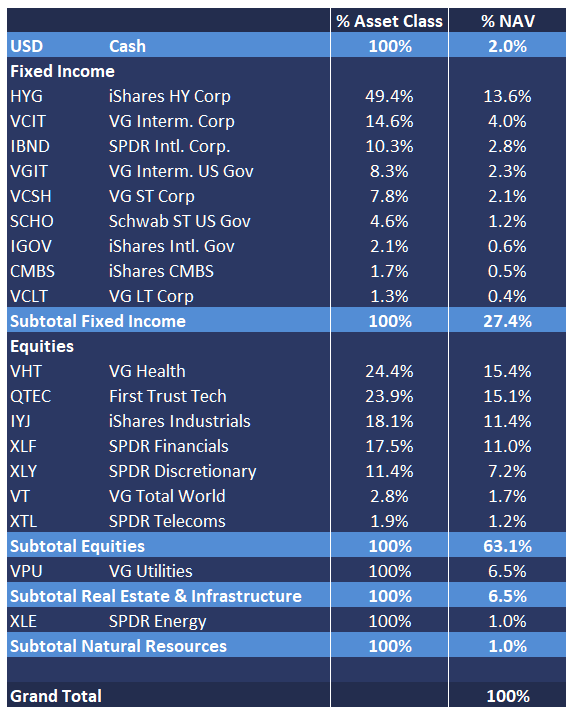
4. GWAP T Rowe Price Capital Appreciation Portfolio
At the end of the mapping exercise this is the resulting GWAP model portfolio:
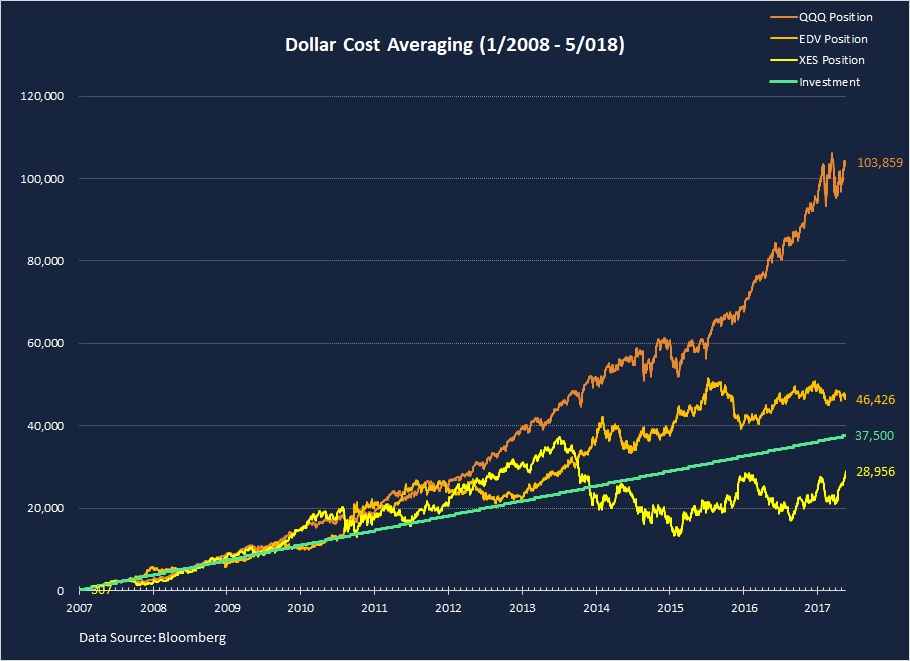
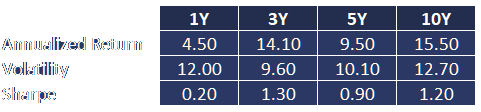
We backtested this portfolio in GWAP to see how it would have performed over the past 10 years. It is important to realized that the backtest assumes a FIXED asset allocation across the period and does not reflect ACTUAL asset allocation changes that may have been made by the T Rowe Price manager in the past.
Backtested performance of the GWAP model portfolio is the following:
The model can be further scrutinized and customized directly in GWAP. Please note however that the GWAP Capital Appreciation Model may have been updated since the publishing of this article, as we are reviewing actual changes in the underlying fund on a monthly basis.
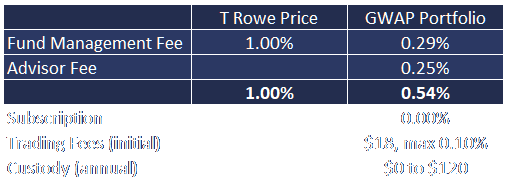
5. Fee Structure
T. Rowe Price charges a management fee of 1%, for the Advisor class, which is not especially lofty compared to peer funds and given the overall performance of the fund.
The GWAP portfolio has a blended average management fee charged by the underlying ETFs of 0.285%. In addition, GWAP platform fee is 0.25%, for a total 0.535%.
In addition to the management fees, investors may pay subscription fees, trading fees, custody fees, etc, depending on their broker/ custodian.
Data Sources
- Morningstar, https://www.morningstar.com/
- GWAP, https://www.gwapfinancial.com/
Disclaimer
This document is not intended as a recommendation of or an offer or solicitation to purchase or sell any security or other investments, or as a recommendation of an investment manager, or as a means to attract any funds or deposits. It is also not an official statement of GWAP Financial.
Although information in this document has been obtained from sources believed to be reliable, GWAP Financial and its affiliates do not guarantee its accuracy or completeness and accept no liability for any direct or consequential losses arising from its use.
Investments mentioned in this document may not be suitable for all investors. Before making any investment, each investor must obtain the investment offering materials, which include a description of the risks, fees and expenses and the performance history, if any, which may be considered in connection with making an investment decision. Each investor should carefully view the risks associated with the investment and make a determination based upon the investor’s own particular circumstances, that the investment is consistent with the investor’s investment objectives.
Opinions expressed herein are not intended to be a forecast of future events, a guarantee of future results or investment advice, and are subject to change based on market and other conditions. In any case, past performance is no guarantee of future results, and future results may not meet our expectations due to a variety of economic, market and other factors. Further, any projections of potential risk or return are illustrative and should not be taken as limitations of the maximum possible loss or gain.
The information contained herein is not intended to be an exhaustive discussion of the strategies or concepts mentioned herein or tax or legal advice. GWAP Financial assumes that, before making any commitment to invest, the investor has taken whatever tax, legal or other advice the investor considers necessary and that the investor has arranged to account for any tax lawfully due on the income or gains arising from any investment product provided by GWAP. GWAP can accept no responsibility for the tax treatment of any investment.
Leave a Reply