
Dollar Cost Averaging (DCA) is an investment technique highlighted by Benjamin Graham in the “Intelligent Investor” and by Warren Buffett in his annual letters as a wise strategy for defensive investors.
It requires the investment of a fixed dollar amount on a regular basis (e.g. monthly) at the price prevailing at the time. In other words, this technique does not require timing the market (i.e. trying to buy low and sell high), but rather requires the discipline of buying regularly through “thick and thin”.
GWAP (www.gwapfinancial.com) supports DCA through its seamless Rebalancing functionality that redeploys regular cash investments and dividends across an entire portfolio according to a predefined asset allocation strategy.
We decided to put this strategy to the test with 3 ETFs on the GWAP platform: 2 outperformers in their asset classes and 1 underperformer over the past 10 years:
- QQQ, PowerShares QQQ Trust Series 1 ETF, tracking the Nasdaq 100 Index, which performed better than most ETFs tracking large capitalization indexes and returned on average 13.2% annually.
- EDV, Vanguard Extended Duration Treasury ETF, tracking the Bloomberg Barclays U.S. Treasury STRIPS 20–30 Year Equal Par Bond Index, which returned 5.43% annually, including gross dividends.
- XES, Spider S&P Oil & Gas Equipment & Services, tracking the S&P Oil & Gas Equipment & Services Select Industry Index, returned -6.07% over the past 10 years.
Summary of the Backtest Results
The DCA strategy would have resulted in significant gains and low average cost base for the outperformers QQQ and EDV. However, it could not protect against sustained losses on XES.
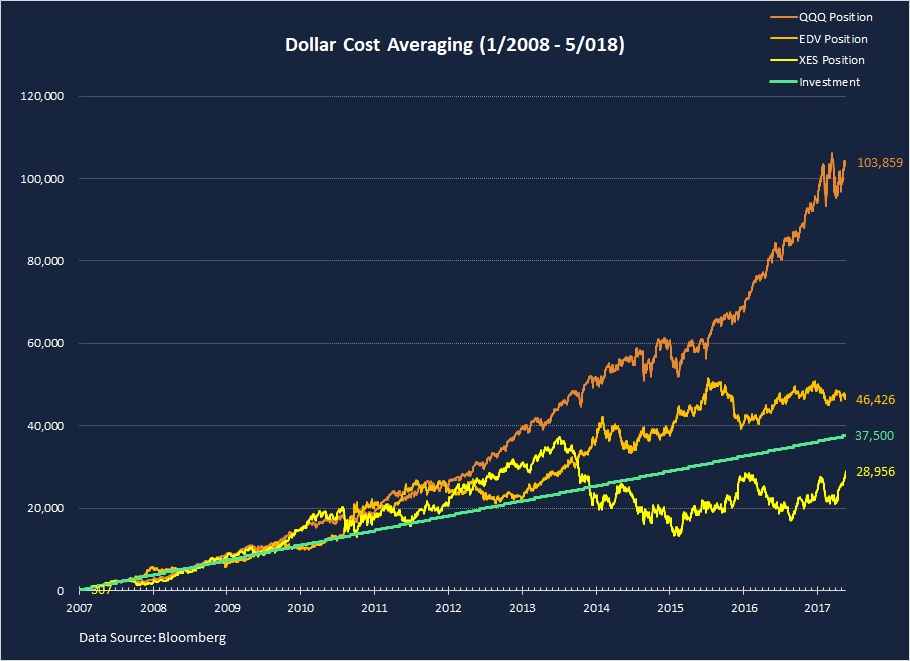
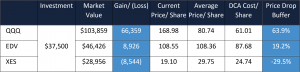
An investment program of $300/ month ($37,500 over 10 years and 4 months), would have accumulated into a position worth $103,859 if invested in QQQ, $46,426 for EDV and $28,956 for XES (please see detailed assumptions at the end of the article).
QQQ’s break even cost base would have been $61.01/ share vs. current price of $168.98/ share (16 May 2017). EDV’s cost would have been $87.68/ share vs. current trading price of $108.55/ share and, finally, XES cost would have been $24.74 versus market value of $19.10/ share.
QQQ Dollar Cost Average Backtest
The chart below shows QQQ’s share price performance from 31 Dec 2007 until 17 May 2018, its rolling average price and the DCA rolling cost/ share.
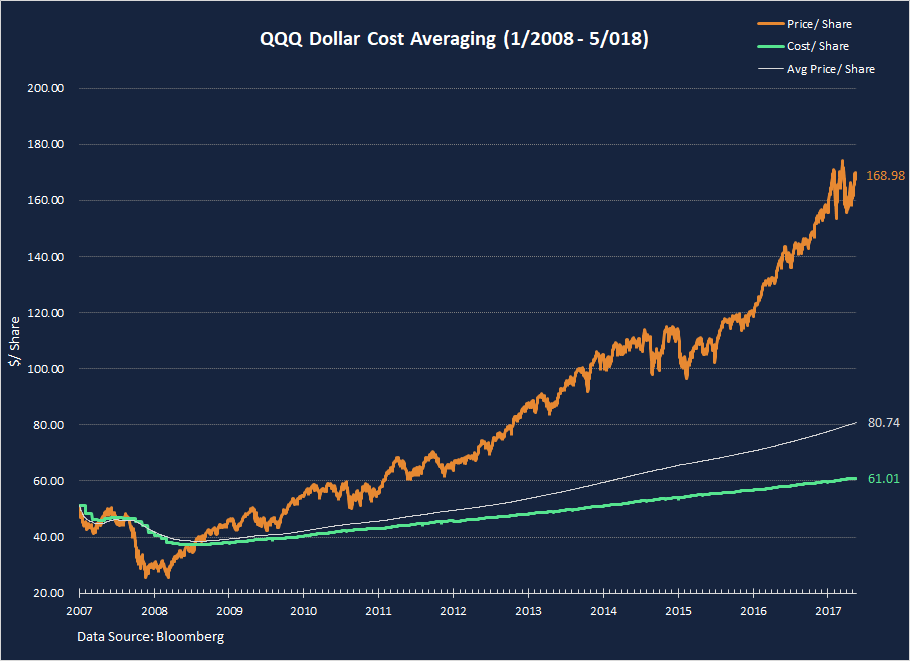
QQQ started the backtest on 31 Dec 2007 at $51.22/ share, corresponding to Nasdaq 100 at 2085. By Fall of 2008 markets entered into the deep 2008/ 09 crisis and QQQ hit its 10 year low of $25.56/ share on 20 Nov 2008.
By then DCA would have accumulated shares at $43.96/ share, so the position would have experienced an unrealized mark to market loss of almost 42%. Still better than a 50% loss compared to a bullet investment, but nevertheless not easy to stomach.
From Oct/ Nov 2008 equity markets continued to struggle, retested its lows in Mar 2009 and QQQ hit $25.74/ share on 9 Mar 2009. By then, DCA investors would have added to their initial position at much lower prices and would have decreased their cost base from $51.22/ share to $38.18/ share. However this would have still been a painful 33% loss compared to the prevailing prices at the time.
Finally, aggressive Fed and government interventions stabilized large banks and markets started to recover. DCA strategy would have turned positive by July 2009 and would have never showed a loss again through May 2018.
The shares purchased during the Great Recession would have helped reduce the average acquisition price of QQQ at $61.01/ share, compared to $168.98/ share (corresponding to Nasdaq 100 at 6902) at the end of the period.
EDV Dollar Cost Average Backtest
For EDV the story is almost the exact opposite: it generally rallied when equities sold off and plummeted when equities rebounded. As a bond tracking ETF, EDV has a negative correlation with QQQ over the past 10 years, or -0.38 as calculated by GWAP.
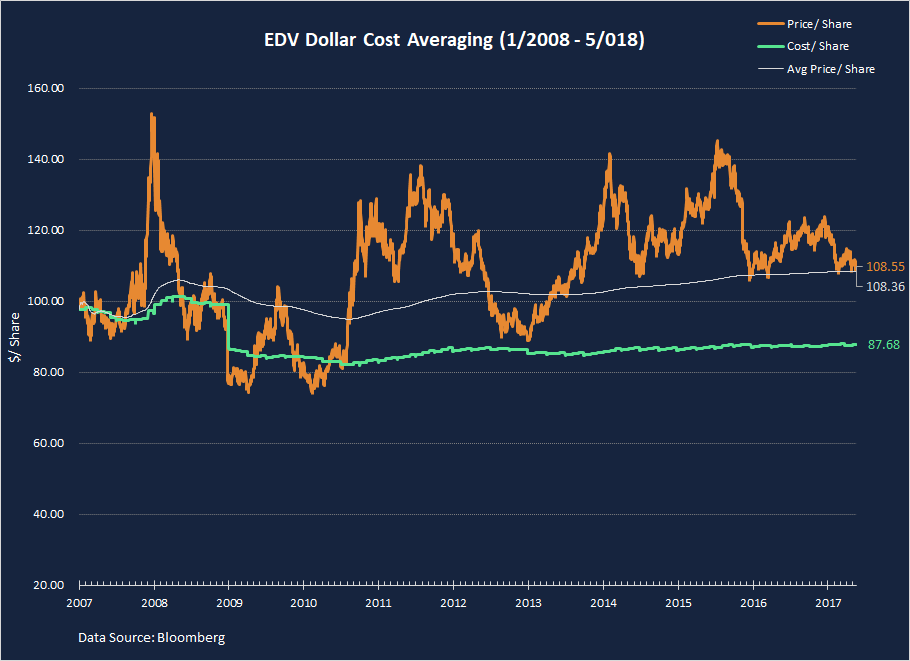
EDV started the backtest at $97.71/ share. It then reached an all time high of $152.87/ share by 18 December 2008, as long term interest rates plummeted due to risk aversion and fears of a new Great Depression.
By then, DCA strategy would have accumulated shares at $97.30/ share and was showing an unrealized gain of 57%. Not bad in an environment where many were suffering huge losses.
However, by end of 2009, as the economic environment started to stabilize, long term interest rates reverted higher and the EDV price plunged below the DCA average. At the end of December 2009, EDV made a large special distribution (return of capital) of $11.08/ share which we modeled as re-invested in EDV. This substantially decreased the break even cost of the position, but also had a negative impact on the market price.
All, in all, unlike QQQ which followed an uptrend since 2009, EDV continued to fluctuate around an average price of $100/ share to $108/ share, with spikes during the Greek/ Eurozone crises and declines during the periods of relative stability.
As a result it took until July 2011 (second Greek bailout and fear of global contagion), for EDV to firmly break above the DCA average.
EDV reached a new post crisis high of $145.31/ share in July 2016, as low inflation and weak economic recovery delayed the Fed’s path to tightening of monetary policy.
However, eventually the Fed restarted policy rate hikes, as well as reversing the QE as of end of 2017. Recently inflation started picking up as well. The combined impact of these factors has been an increase in long term yields to over 3.2% (30 years) and corresponding decline in EDV price, currently at $108.55/ share, compared to the DCA average of $87.68/ share.
XES Dollar Cost Average Backtest
XES tracks the index of oil equipment and servicing companies whose economic performance and valuations depend heavily on the oil price.
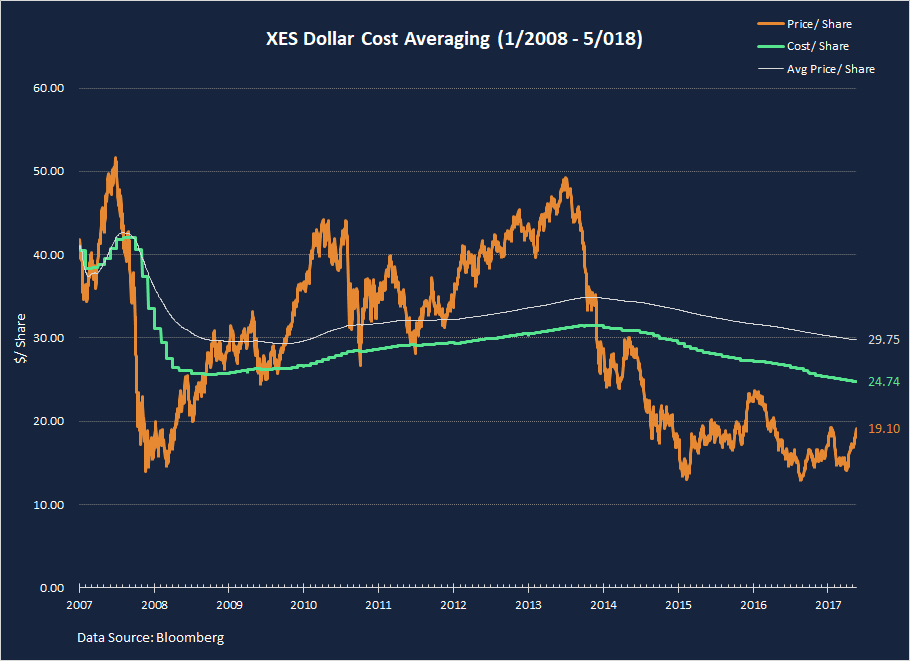
On 31 Dec 2007, at the start of the backtest, WTI oil was $96/ bbl and XES was trading at $40.58/ share. Oil reached an all time high of $147/bbl in the summer of 2008 and so did XES, at $51.70/ share. By then, the DCA strategy would have accumulated XES at an average price of $40.70/ share, showing an unrealized gain of 27%.
However, during the Great Recession oil prices plummeted all the way to $33/bbl by end of 2008, dragging with it XES, down to $15.62/ share. At that time the DCA strategy would have shown a loss of more than 53% based on an average cost of $33.57/ share.
Eventually, as the global economy emerged from the recession, oil prices rebounded above $100/bbl by spring 2011 and the DCA strategy was again firmly in profit territory.
Crude continued to hover around $85 to $105/bbl for the following 4 years, which supported XES.
However, as of mid-2014 oil prices started to plummet again, this time due to higher supply from the US shale, rather than from weak global demand. XES crossed its DCA line to the downside on 28 Nov 2014 and hasn’t recovered in positive territory since. Nevertheless, the DCA strategy would have continued to accumulate cheaper shares and would have decreased the average cost to $24.74/ share, almost 40% below the starting point in December 2007, but still 30% above current market price.
However recent oil price increases due to OPEC supply cuts and higher geopolitical risk (e.g. restart of Iran sanctions) are likely to have a positive impact on XES going forward.
Conclusions
- Dollar Cost Averaging works best on volatile investments with a positive return over the long term.
- DCA is not a panacea and is not likely to produce positive returns for investments that are in a sustained decline
- DCA is not a substitute for doing proper due diligence on an investment and for regular monitoring
DCA Backtest Assumptions
- Start with a $300 initial investment on 1 Jan 2008.
- Invest additional $300 at the end of each month, regardless of the price, until 17 May 2018.
- Gross dividends are re-invested during the same day they are distributed.
- Fractional shares are allowed (e.g. investment in fractional shares is possible via a number of brokers).
- No taxes, trading costs, or any other fees were assumed, other than those paid to the ETF managers and already reflected in the market price.
Disclaimer
This document is not intended as a recommendation of or an offer or solicitation to purchase or sell any security or other investments, or as a recommendation of an investment manager, or as a means to attract any funds or deposits. It is also not an official statement of GWAP Financial.
Although information in this document has been obtained from sources believed to be reliable, GWAP Financial and its affiliates do not guarantee its accuracy or completeness and accept no liability for any direct or consequential losses arising from its use.
Investments mentioned in this document may not be suitable for all investors. Before making any investment, each investor must obtain the investment offering materials, which include a description of the risks, fees and expenses and the performance history, if any, which may be considered in connection with making an investment decision. Each investor should carefully view the risks associated with the investment and make a determination based upon the investor’s own particular circumstances, that the investment is consistent with the investor’s investment objectives.
Opinions expressed herein are not intended to be a forecast of future events, a guarantee of future results or investment advice, and are subject to change based on market and other conditions. In any case, past performance is no guarantee of future results, and future results may not meet our expectations due to a variety of economic, market and other factors. Further, any projections of potential risk or return are illustrative and should not be taken as limitations of the maximum possible loss or gain.
The information contained herein is not intended to be an exhaustive discussion of the strategies or concepts mentioned herein or tax or legal advice. GWAP Financial assumes that, before making any commitment to invest, the investor has taken whatever tax, legal or other advice the investor considers necessary and that the investor has arranged to account for any tax lawfully due on the income or gains arising from any investment product provided by GWAP. GWAP can accept no responsibility for the tax treatment of any investment.
Razvan
Nice and thorough analysis, but in my opinion for any realistic backtest you need to factor in trading costs/commissions and slippage. You will be amazed how much those influence the charts.